![HRPS Logo1.png]](https://knowledgebase.hrperformancesolutions.net/hs-fs/hubfs/HRPS%20Logo1.png?height=50&name=HRPS%20Logo1.png)
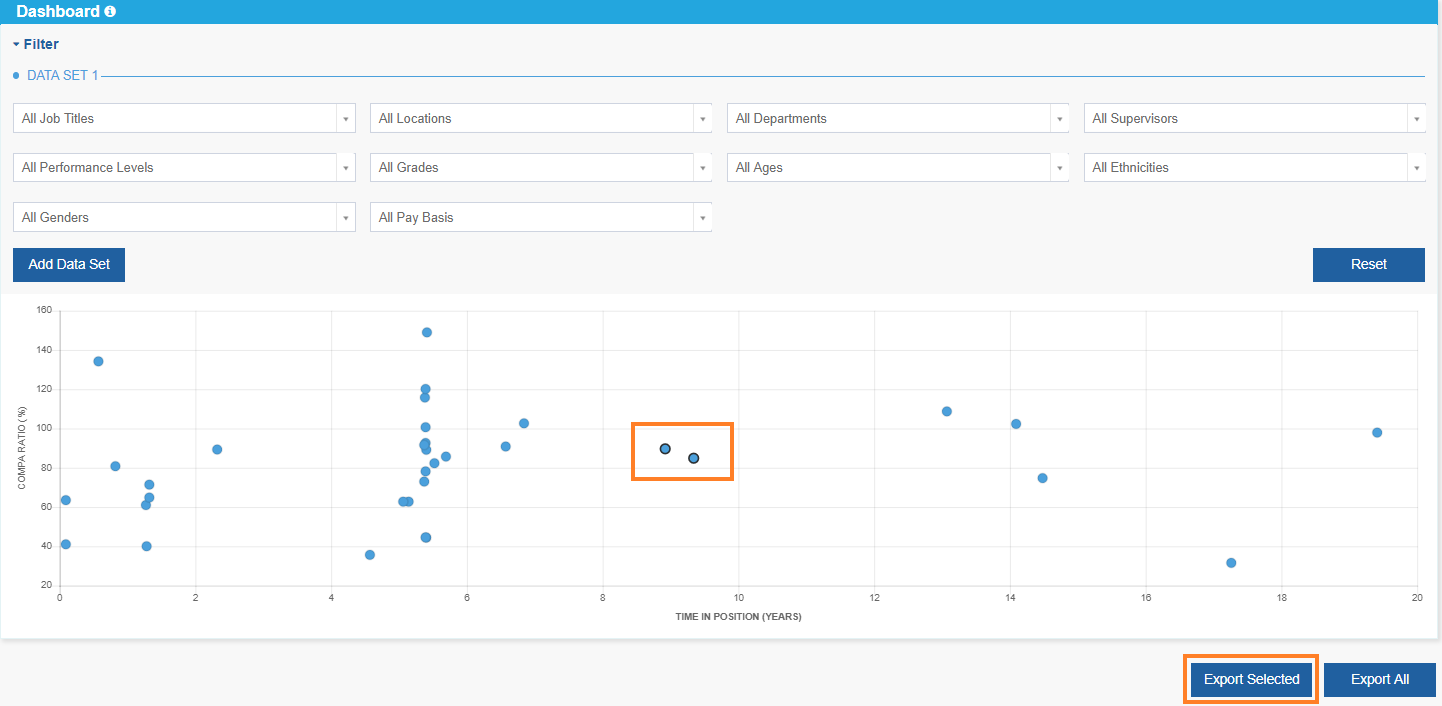
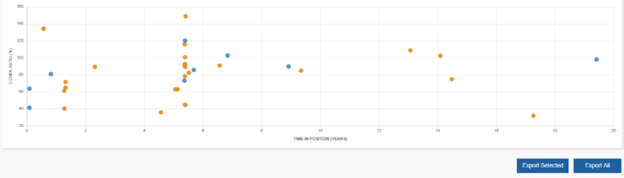
The Dashboard will provide the ability to easily identify any possible internal equity issues such as “equal pay for work” blind spots.
Dashboard Display
The display on the Dashboard uses two variables that pull directly from your employee data:
-
Time in Position on the x axis, and
-
Compa Ratio on the y axis.
Both Time in Position and Compa Ratio must be populated for each employee within Employee Maintenance to display the information appropriately on the Dashboard.
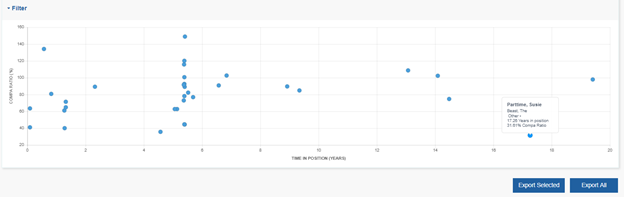
Each data point on the Dashboard represents an employee. When hovering over any of the data points, individual employee information will appear including:
-
Employee Name
-
Gender
-
Ethnicity
-
Age
-
Time in Position
-
Compa-Ratio
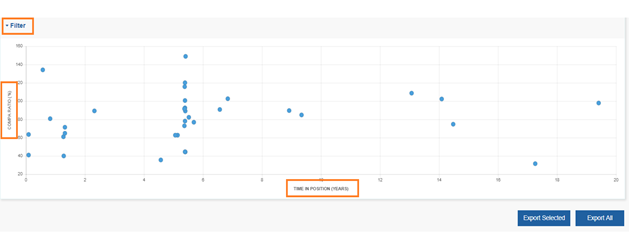
Filtering Dashboard Data
Home Page > Filter
You can filter data displayed on the dashboard. To utilize the filtering options, the corresponding information must be populated for each employee. The following data fields are available as filter options:
-
Job Title
-
Location
-
Department
-
Supervisor
-
Performance Level
-
Job Grade
-
Age
-
Ethnicity
-
Gender
-
Pay Basis
Creating Filters
Each Data Set is programmed to default to “All,” so unless filters are created, your dashboard will display all employees within the organization. You have the option to create up to two comparable data sets to compare/contrast employee compensation information.
To create a Filtered Data Set: Filter > Use the Drop Downs within the Data Set to select desired filters.
-
Once selected, your data set is automatically updated
-
Data set will be plotted in Blue
To create a second Filtered Data Set: Add Data Set > Use the Drop Downs within the 2nd Data Set to select desired filters.
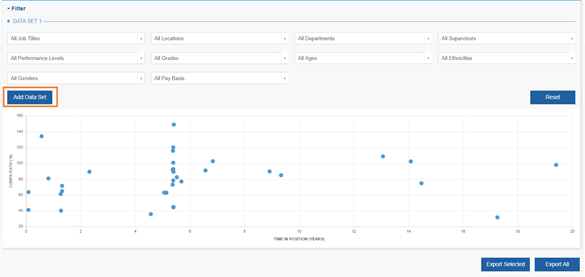
-
Once selected, your data set is automatically updated
-
2nd Data set will be plotted in Orange
Resetting Filters
You can make manual adjustments to any of the data filters or Reset everything back to the default setting of “All” employees.
To Reset back to default settings: Select Reset
Exporting Your Data
Exporting allows you to have more access and ability to analyze your data. You can export data in two ways:
-
Export All Data displayed, or
-
Export Selected Data displayed
To Export All Data: Export All > Open .csv file
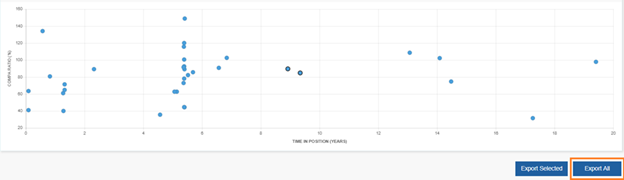
To Export Selected Data: Export Selected > Open .csv file
-
Select employees or dots on the scatterplot. Black border will surround the dot.
-
To deselect, reselect the dot.