![HRPS Logo1.png]](https://knowledgebase.hrperformancesolutions.net/hs-fs/hubfs/HRPS%20Logo1.png?height=50&name=HRPS%20Logo1.png)
What's New
This update contains information on 3 new dashboards:
- Engagement Solutions Analytics
- Tracking
- New Hire Evaluation Status
The Engagement Survey is now available in the master list of forms to be copied to the company forms list. This form can be added by the employee from the Performance Pro home screen. The form has a total of 36 questions.
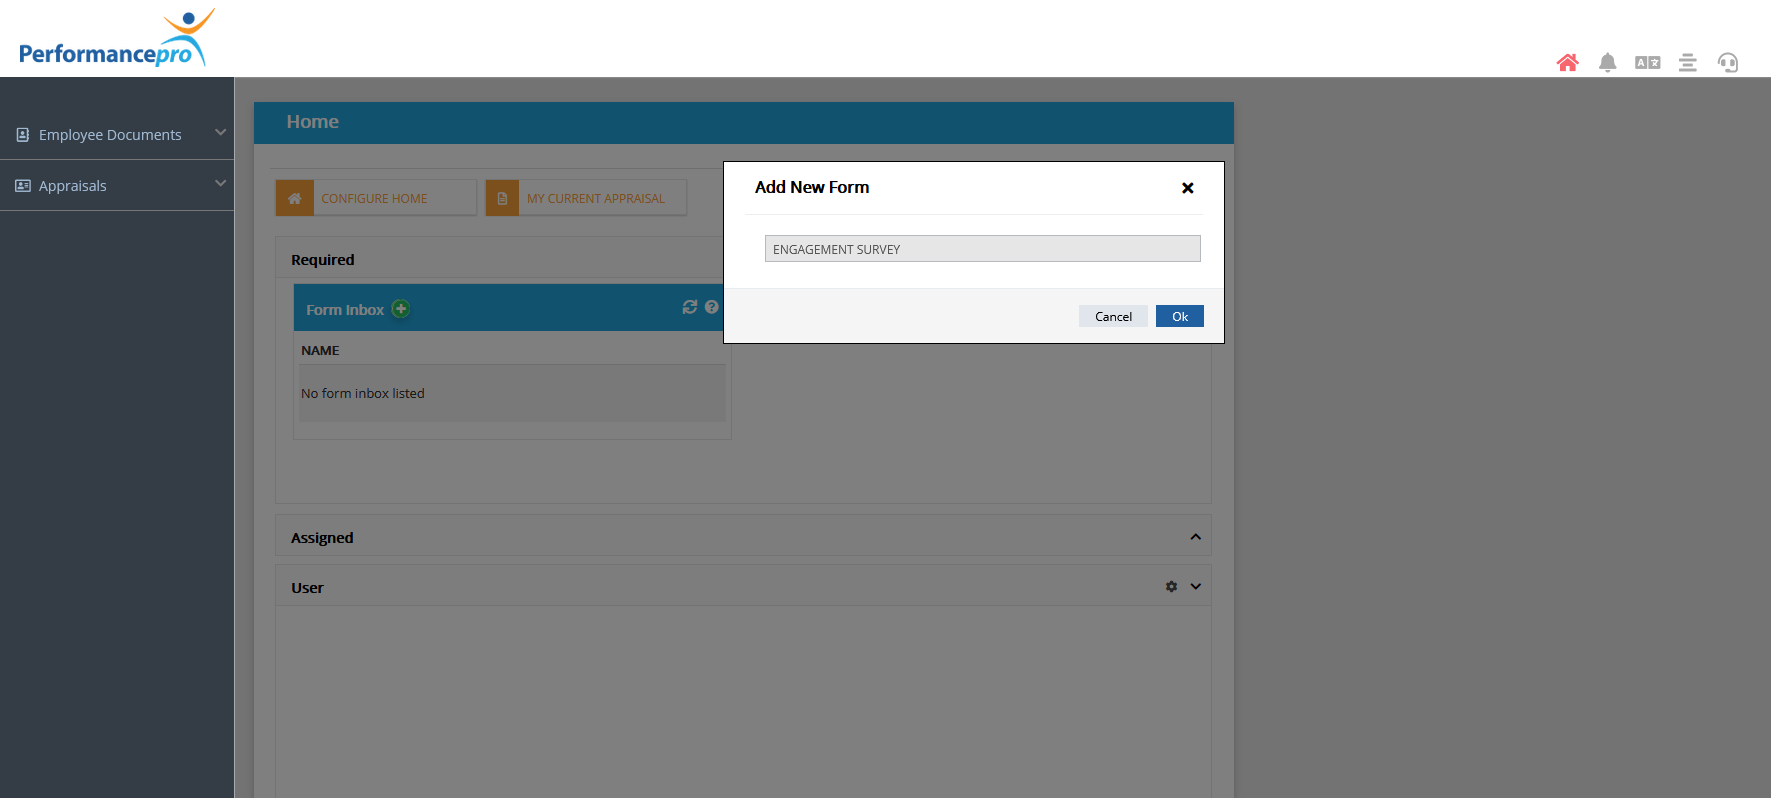
Once you launch the Advanced Analytics tool from the Reports menu in Performance Pro, click on the new Engagement Solutions Analytics dashboard.
Set the employee status filter to active. You will see filters for the form date, form status and engagement survey questions. Other available filters are location, division and department.
The Average Engagement Score gauge chart is the company average of the first 34 questions in the Engagement Survey. The Employee Net Promoter Score is the company average of question 35. The Loyalty & Retention Score is the company average of question 36.
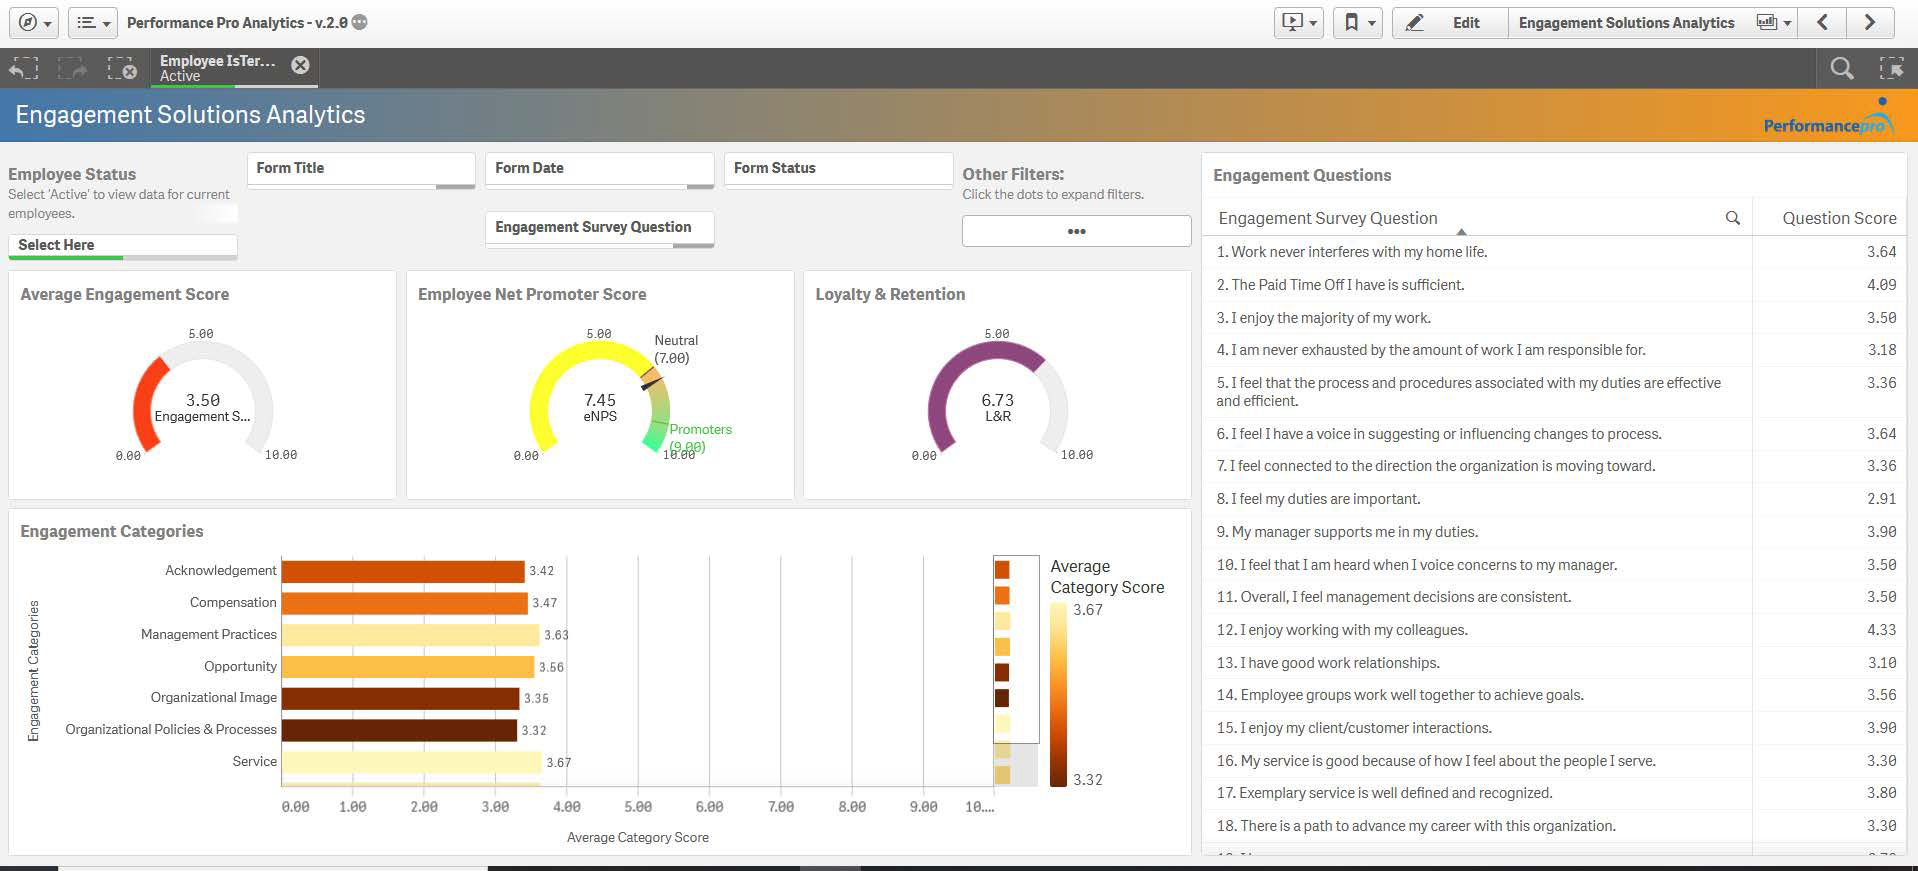
Questions 1-34 in the Engagement Survey form feed into the following eight categories:
- Acknowledgement
- Compensation
- Management Practices
- Opportunity
- Organizational Image
- Organizational Policies & Processes
- Service
- Teamwork
- Work Life Balance
The chart Engagement Categories displays the company average of each of the categories. You can click on the bar and filter by each of the categories which will display the questions corresponding to that filter.
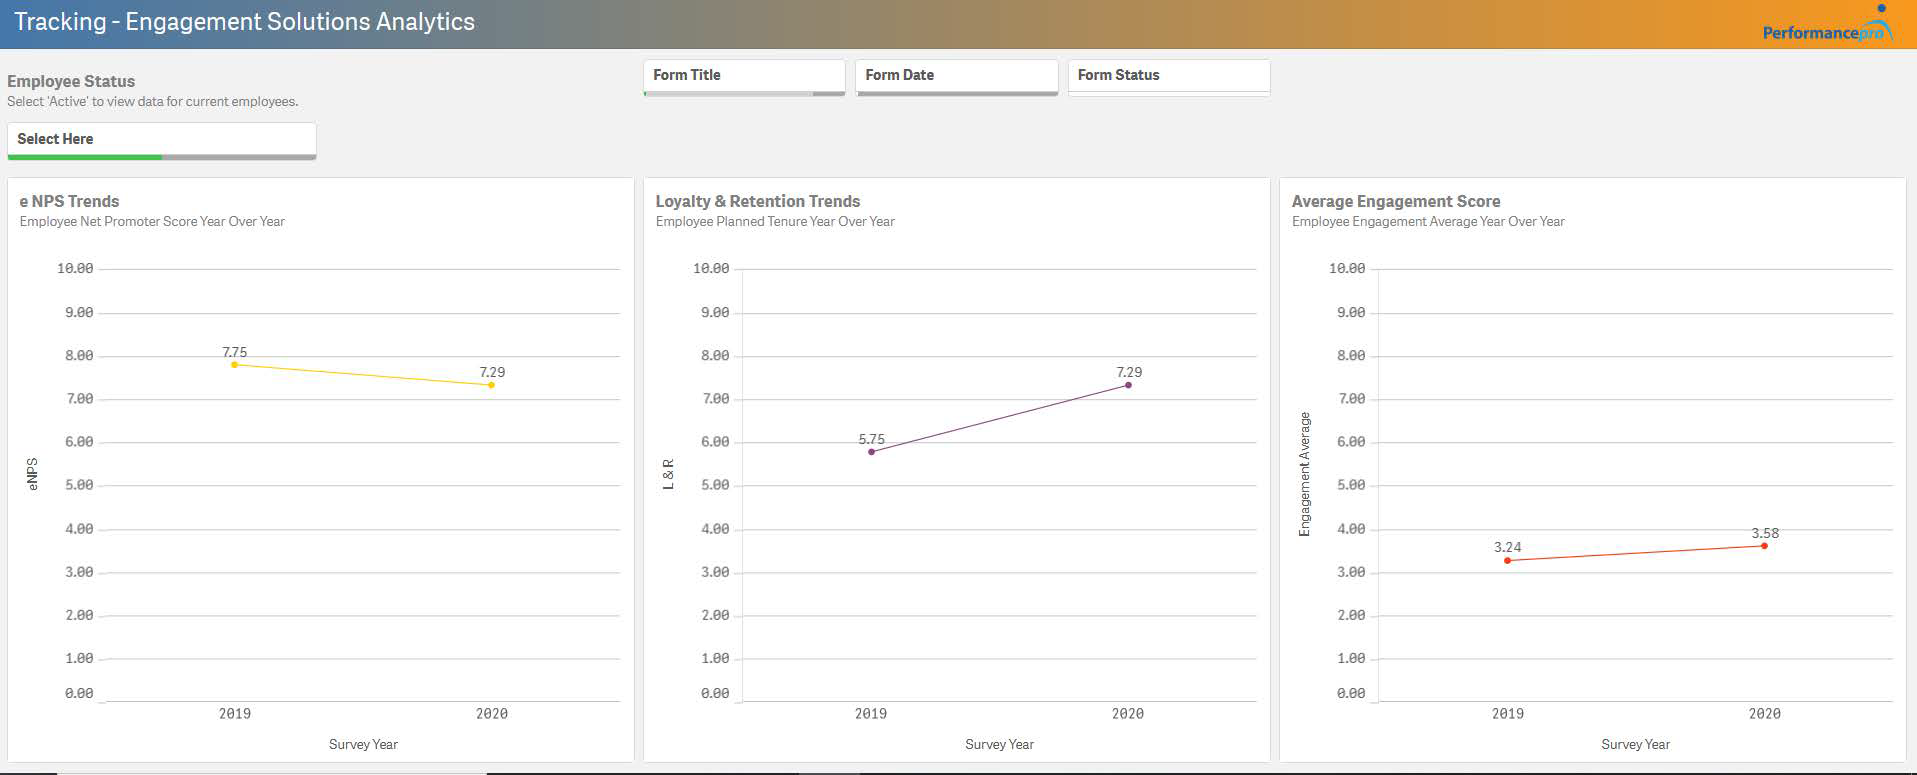
The Tracking dashboard will display the eNPS, Loyalty & Retention, and Engagement score trends over time. The form date filter can be used to track the different range of dates.
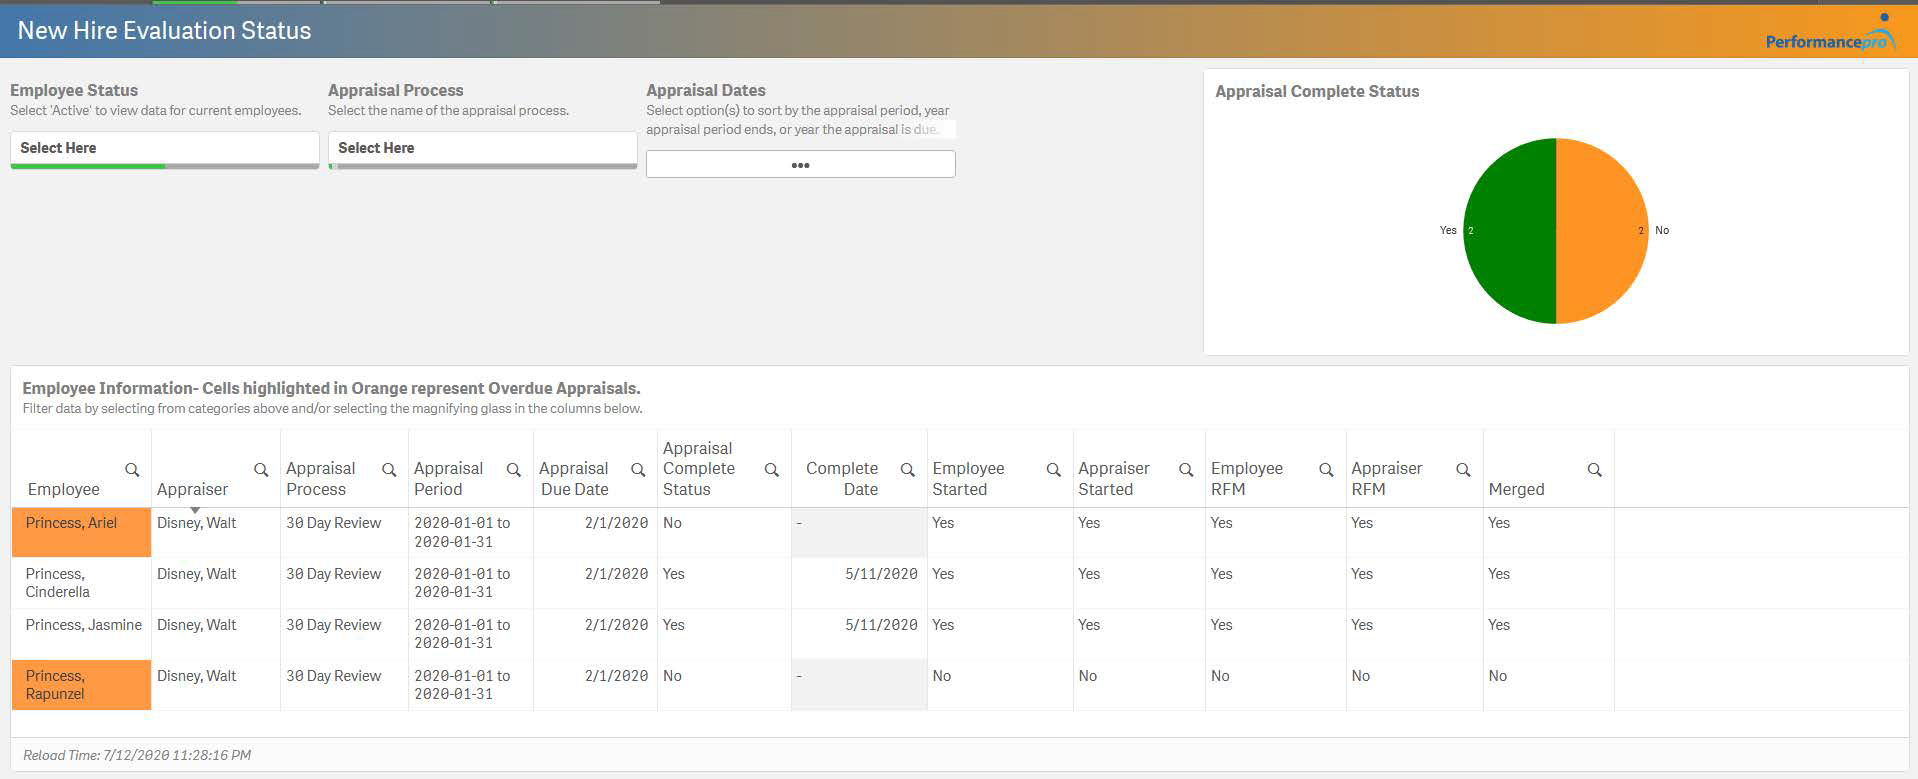
New Hire Evaluation Status Dashboard
This dashboard displays information for concurrent appraisals that are added through the onboarding process in Performance Pro. The employee status filter must be set to active. The appraisal process filter will display all process names which can be selected (for example, 30-60-90 day reviews). The pie chart visualization will show you the number and percentage of complete and incomplete appraisals. In the table, the names that are highlighted in orange represent the appraisals that are overdue based off of the appraisal due date.
 Did this answer your question?