![HRPS Logo1.png]](https://knowledgebase.hrperformancesolutions.net/hs-fs/hubfs/HRPS%20Logo1.png?height=50&name=HRPS%20Logo1.png)
Running a Report:
- From the Menu, navigate to Learning Reports.
- Qlik will open in a new window in the browser.

- Select The Learning Center from the available Streams. (Performance Pro and Compease will also display under Streams if you have those programs).
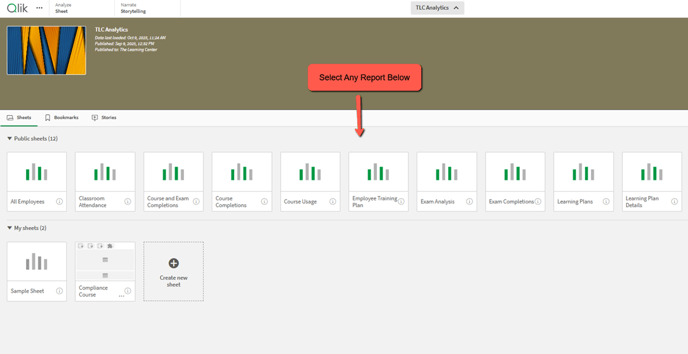
- Next, select TLC Analytics.

- Choose which type of report you would like to view from the Public Sheets section.
You can apply Filters to narrow down data sets by using the filter options.
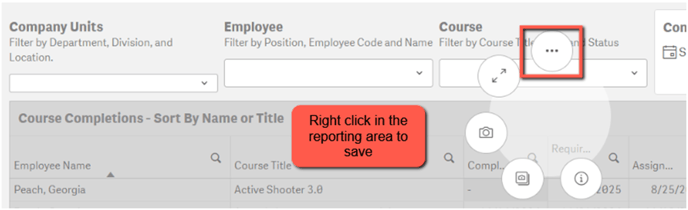
- At the top of the report, you can filter by:
- Company Units
- Employee
- Course
- Date Range

After you filter your data, you will be able to view what filters have been applied at the top of the page.

You can also use the interactive Search tool, clicking on data directly in the report columns to apply filters instantly.
Click the Search tool in any section to:
- Type a word or date into the search bar to locate items quickly OR
- Select items from the dropdown.
- A green box with a check mark shows selected items.
- Click an item again to deselect it.

Downloading and Saving your report
- Right-click anywhere inside the report area and select the ellipsis ( … ) icon.
Choose Download as...
- Options include:
- Image
- Data (CSV file)


- The report will save to the Download folder on your computer as a CSV spreadsheet.
Using Bookmarks to save data points for a report:
If you have specific data points you want to save for later reference, use the Bookmarks functionality.
- After filtering your data, click Bookmarks.
- Click on Create new bookmark to name this data set
- Ensure that Save sheet location and Save layout boxes are both checked, then click Create.

- The Bookmarks screen will reopen, allowing you to name your new bookmark. Enter the Title and Description, if needed, and then click the check mark to accept and create.

Creating a Custom Report:
If you need to add or remove data fields in a report, creating a customized report, you will need to duplicate the report. We suggest filtering your data and saving it with Bookmarks prior to creating a duplicate report.
- Navigate to the top right corner of the screen and click on Duplicate.
- Change the title of the report under Sheet properties.
- Click inside the box that holds the course data until you see it is highlighted in a (green) colored frame.
- You will know you are inside the box when the other data boxes on the screen appear greyed out.

- Under Chart Suggestions, click on Data and the Add Column dropdown.
- You can type in the name of the column you want to add or scroll through the list then click on title.
- To remove an column, right click on it and select Delete.
- Columns can also be moved in the order you want them to show on the report by dragging and dropping into place.
Once you are finished, click Done editing, at the top right of the screen. Your custom report can be found by clicking Sheets.
