Advanced Analytics: Manager Bias
The Manager Bias report shows you information on average appraisal scores. The Gap Scoring chart shows a side-by-side comparison of the average score the Appraiser gave their employees and the average self-appraisal score combined. The Final Rating table shows the appraisal rating for the employees with links to view the summary comments.
Upon opening Advanced Analytics (and running the Performance Pro V2.0 App), the overview of the standard sheets displays. Click on the Appraisal Status dashboard to apply filters. (We will move to the Manager Bias Report after applying filters.)

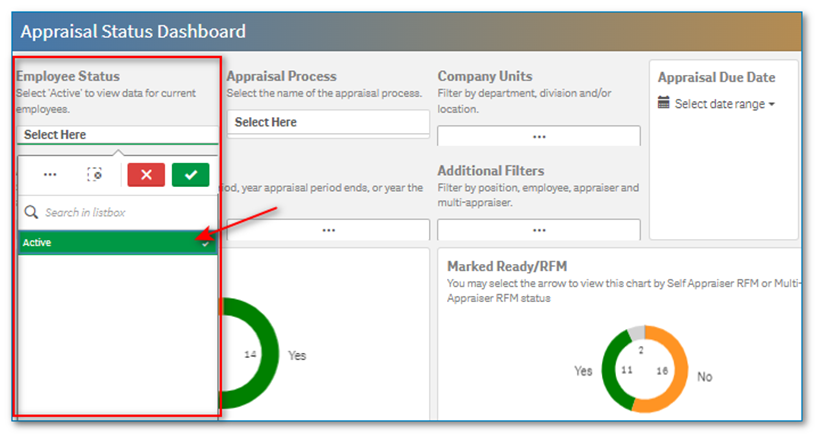
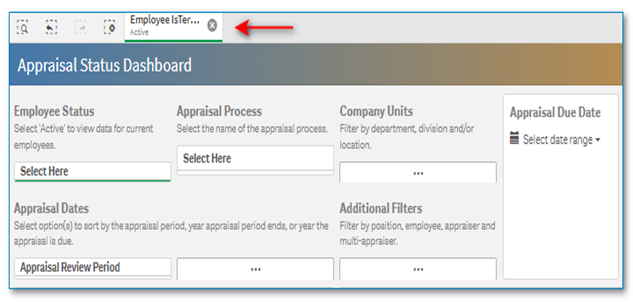
Click in the Employee Status “Select Here” box, click Active, then the green checkmark. This will filter the data based on active employees. Once selected, the filter will appear above the dashboard until it is removed. The filter will stay even if you move to another sheet.
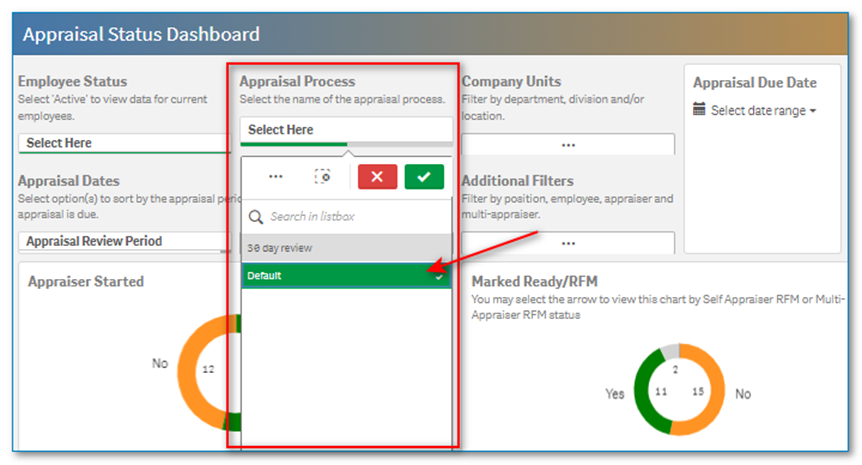
Click in the Appraisal Process “Select Here” box, select the appraisal process you desire, then the green checkmark. This will filter out all appraisals except for the selected one.
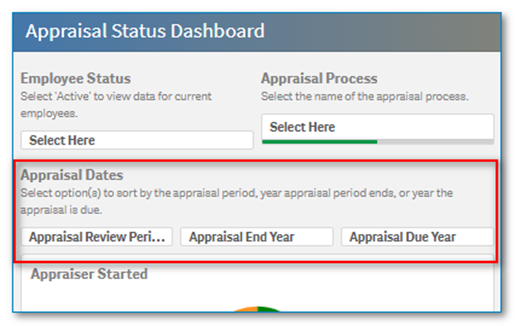
From the Appraisal Dates area select the date range(s) you desire to filter by. Options to choose from include Appraisal Review Period, Appraisal End Year, and Appraisal Due Year. Click the option, make your date selection, then click the green checkmark.
Note: If the three options aren’t visible, click the … button in the Appraisal Dates area and they will appear.
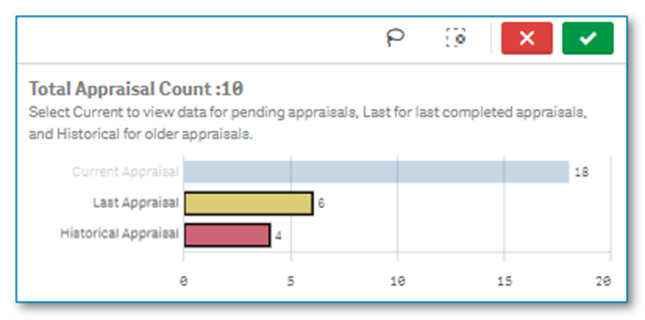
From the Total Appraisal Count graph on the right side of the screen, click on the Last Appraisal and Historical Appraisal bars, then the green checkmark. This will ensure your report only contains appraisals that are marked complete.
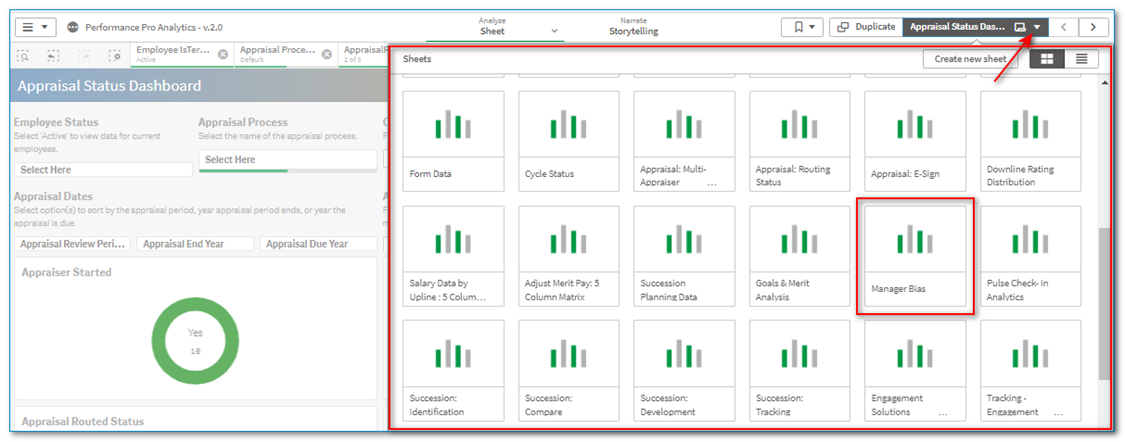
Click on the Sheets dropdown in the upper right corner. Click on Manager Bias. This will take you to the Manager Bias report.
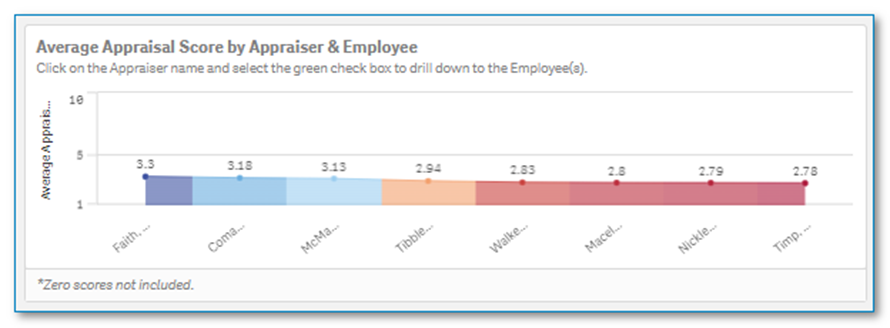
The “Average Appraisal Score by Appraiser & Employee” chart is a drill down chart. The names across the bottom of the chart are appraisers and the number on the top is the average score that appraiser gave their employees during the selected appraisal period(s).
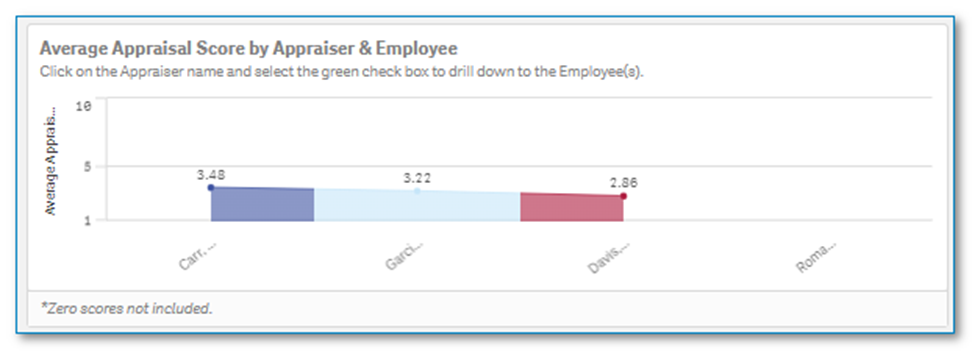
To drill down on a specific appraiser, either click their name on the chart or choose them from the Appraiser dropdown in the upper right corner of the screen, then click the green checkmark. This will drill down to that appraiser and show each of their employee’s individual scores.

All charts and tables will now display employee information pertaining only to the selected appraiser.
The names on the “Average Appraisal Score by Appraiser & Employee” chart now lists the employees the appraiser appraised along with the average score given.
The “Gap Scoring” chart shows the gap between the score the manager gave vs. the score the employee(s) gave themselves.
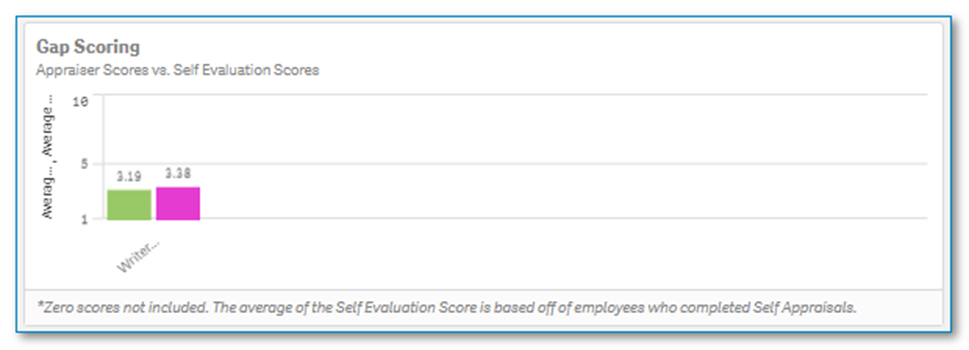
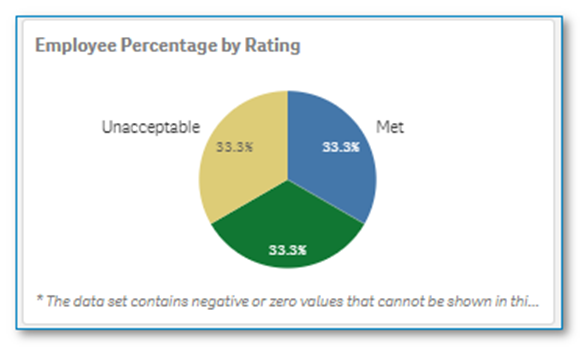
The “Employee Percentage by Rating” pie chart show the employee percentage by rating under the selected Appraiser. Hover over the Pie chart to view the number/share of employees that make up that section.
The “Final Rating-Employee” table gives you detailed information on each employee. You can double click the links at the top of this table to jump to reports that show summary comments given by the Appraiser or employee.

Refer to the article titled “Downloading/Exporting Data” for instruction on exporting the data.
![HRPS Logo1.png]](https://knowledgebase.hrperformancesolutions.net/hs-fs/hubfs/HRPS%20Logo1.png?height=50&name=HRPS%20Logo1.png)